

Delta's Financial Results: Billions in Revenue, Strong Performance, but Two Big Risks

To understand business in Zimbabwe, you need to understand Delta Corporation, the country’s largest listed company and one of the few companies with over $1 billion in revenue.
Delta’s recent results reveal so much about the Zimbabwean economy, business operations, taxation, and what 2026 is going to look like that we will need to split these posts into a series.
Here is Part 1: Billions in Revenue, Strong Performance, but Two Big Risks.
Let’s Unpack!
The Headline Numbers: Delta Corporation
The headline figures were impressive. In every category, Delta showed strong improvement.
Revenue: $1.09 billion (+35%)
Operating income: $208.7 million (+42%)
EBITDA: $235.9 million (+42%)
Total taxes paid in Zimbabwe: $306 million (+37%)
Attributable earnings per share: US 11.44 cents (+35%)
Total dividend per share: US 5.0 cents (+52%)
Hitting these numbers for a business the size of Delta is not easy.
There is one blemish, however, which I will talk about at the end, that represents a risk and an opportunity.
For now, let’s unpack the revenue performance.
The 35% growth is slightly distorted because it includes Schweppes, which was not included in last year’s revenue but is this year, as Delta took over the business. That adds about $100 million in revenue.
A better way to evaluate performance on a like-for-like basis is to look at the growth in volumes sold. Below is that data.
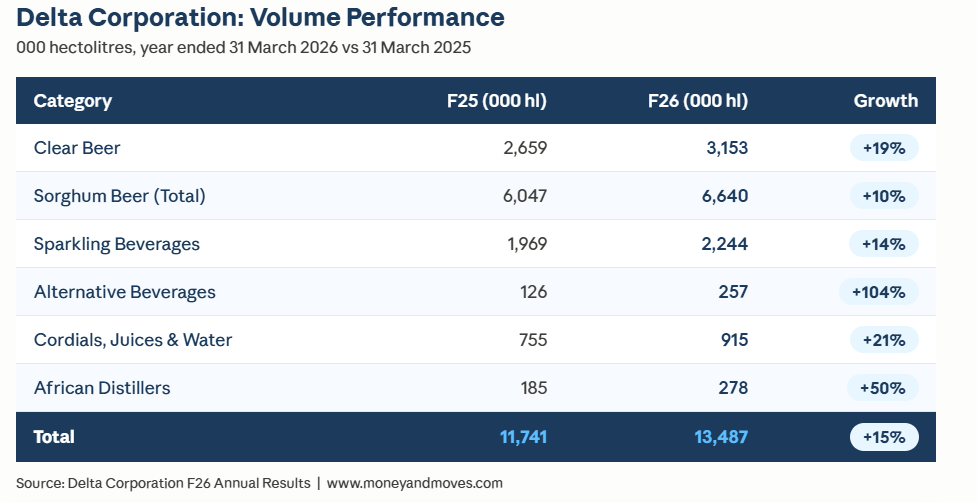
Across all categories, Delta recorded strong volume increases with an overall a 15% increase.
To illustrate just how impressive this is, compare it with peers in other countries.
AB InBev, the largest beer company in the world, disclosed in its latest results that in its other African markets, revenue grew by low-teens and volumes by low-single digits.
What that means is that peers in Africa are growing volumes at roughly 1 to 4%. Delta is growing at least three times faster as a billion-dollar revenue business, of which there are fewer than 400 in Africa.
This tells you two things.
Delta has done well in allocating capital to allow it to scale and execute fast. However, I think they may have had room to be even more aggressive, which perhaps explains why their capex commitment has increased from $70 million in FY2025 to $120 million in FY2026.
Also worth noting that currently, Delta has a return on invested capital (ROIC) of about 40%, which is very strong. For context, Coca-Cola, East African Breweries, and AB Inbev all have a ROIC of less than 20%.
This means for every $1 that Delta has invested into their business, they get about 40c of profit out. With those ratios, it makes sense to keep investing in more capex.
The other thing this fast growth rate tells you is about the Zimbabwean economy overall.
What Do Delta’s Numbers Say About the Zimbabwean Economy?
One way to get a read on economic growth is to look at Delta’s performance in terms of volumes in Zimbabwe.
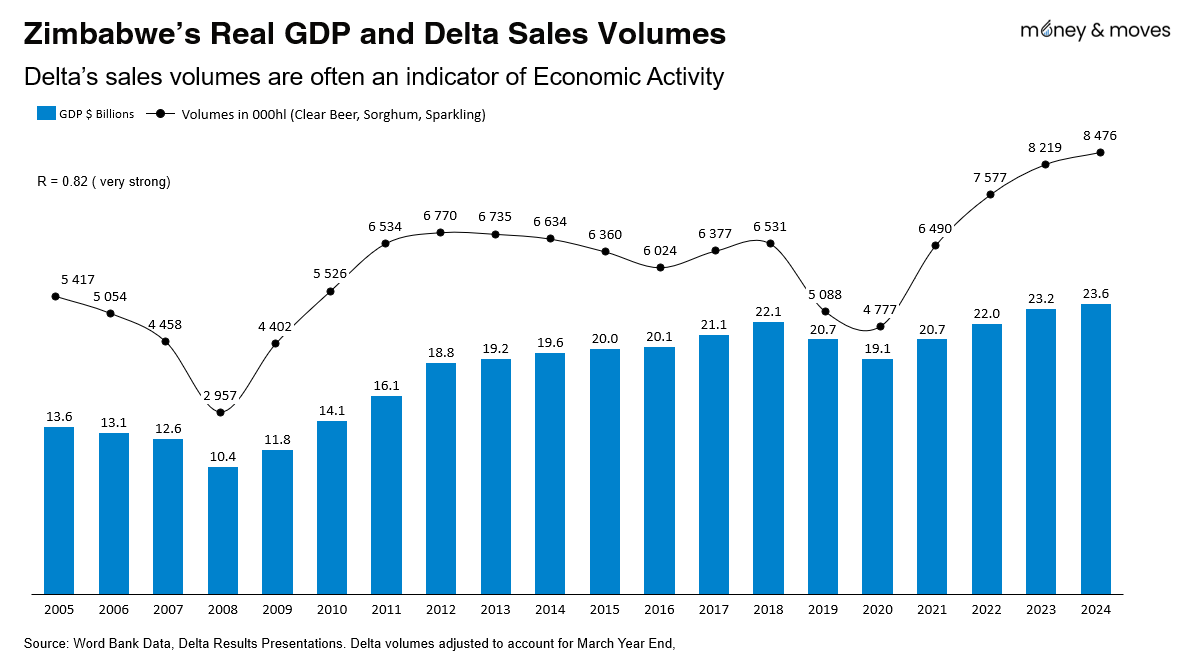
Below is a chart that maps Real GDP and Delta Volumes over 20 years. Note that since GDP is measured from January to December and Delta’s results run from April to March, we adjusted the volumes to make them match up.
What you see is that the relationship between real GDP and Delta’s volumes is very strong.
What was clear from the half-year results was that Delta was having an exceptional year, exceeding forecasts, posting a 21% increase in organic growth.
This indicated that the 6% growth forecast by the IMF, and even the offcial 6.6% growth forecast from the government, could have been on the low end.
It is no surprise that the latest numbers indicate that the Zimbabwean economy grew 7.5%, which should be one of the highest growth rates in Africa.
Given this backdrop, one other data point worth looking at is whether Delta’s growth is accelerating or slowing down. In other words, were volumes in the second half of the year greater than in the first half?
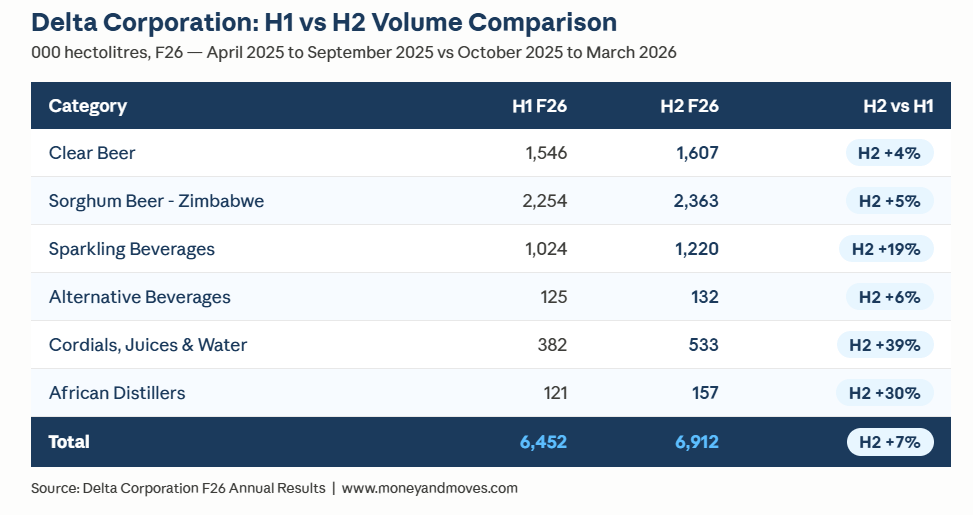
From the above, we see that the second half, from October 2025 to March 2026, was stronger across every category.
One may assume that the second half of the year will always be higher due to the December holiday period, where people are more likely to consume more alcoholic and soft drinks.
This makes sense; however, there have been periods where that was not the case, so the higher volumes do indicate some momentum going into 2026.
The half-year results for Delta this year will be very interesting to watch, as there are growing economic headwinds, particularly fuel price inflation linked to the Iran war.
The Gap: Where Delta’s Performance Shows Weakness
With all that said, Delta’s performance does have one material gap.
While the overall numbers were impressive when it comes to profitability, there are some significant differences between segments.
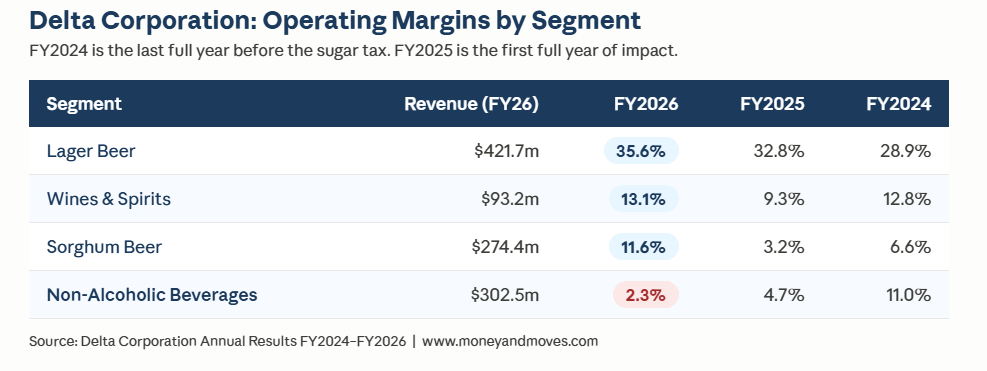
From the above, we see that the beer business is doing extremely well with an Operating Margin of 35.6%, Sorghum and Wines & Spirits (Afdis) are good, but the Non-Alcoholic Beverages business is underperforming quite significantly on profitability.
Part of this could be as a result of the acquisition of Schwepps, which is not fully consolidated. Acquisitions often come with one-time costs and restructuring that can dilute profitability.
However, the margins in FY2024 were also not great, so this cannot be entirely related to Schweppes.
One factor contributing to the margin compression is the sugar tax.
The sugar tax is a levy on the sugar content of beverages, introduced in Zimbabwe in January 2024. It was introduced to discourage excessive sugar consumption and to generate revenue for the treatment of diseases such as cancer, and so far has raised over $60 million.
The current tax is US$0.001 per gram of sugar, so the more sugar in a drink, the more tax is paid.
For example, a 500ml bottle of Coke often has about 50g of sugar, which would result in a tax of 5c.
Now, a 500ml bottle of Coke generally is priced around $0.50. So with that in mind, we can model the impact of the tax on profitability at a gross profit level.
As shown in the table below, even if you pass on the full 100% cost to the customer, the core profitability still drops because you don’t make any profit on the additional 5c in price.
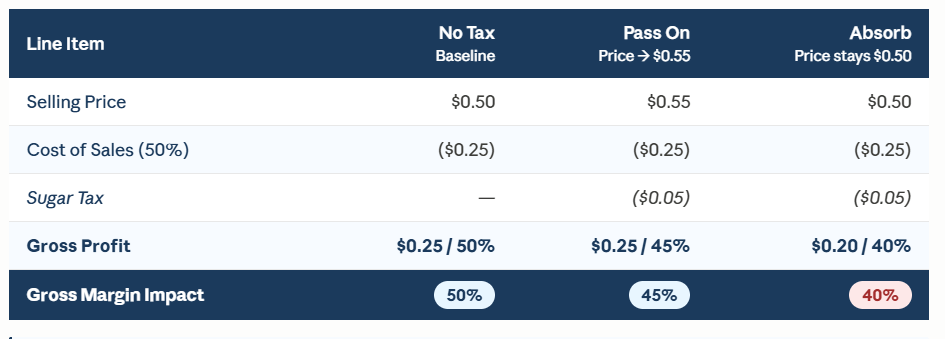
The larger impact occurs if no costs are passed on, causing gross profit margins to decrease from 50% to 40%.
Delta’s Non-Alcoholic division generates $302 million in revenue. With a 10% reduction in gross margin, as in our example, this results in a $30 million decline in profit, similar to what they reported in their results.
To be clear, Delta does not disclose its actual gross margins at the segment level, but we know from its competitors that 50% is a reasonable estimate for the soft drinks category.
Now here is an interesting question.
If two companies operate in the same market and sell similar products, why might one be currently more profitable than the other?
We will answer that in Part 2, where we will look at Delta’s biggest competitor, Varun Beverages, and what their numbers reveal about the opportunity inside Delta’s Non-Alcoholic business.
In Part 2, we will also unpack the other major issue facing Delta, a $97 million tax assessment from ZIMRA that is currently under appeal.
All of the above and more are critically important in understanding Delta’s results, the business environment, and ultimately, Where’s the Money, and What’s the Move?
More of that in Part 2. But what do you think about Delta’s results so far?
Thanks for reading. If you enjoyed this, please forward it to someone in your network.
P.S. I am working with publicly available information, so I could be wrong or missing something.
These pieces always shine a light on business in Zimbabwe, revealing opportunity gaps that we may not have considered prior. Thank you for such detailed information every time. I look forward to Part 2