


Stories To Watch This Week
Here are some stories to watch this week:
OK Zimbabwe is restocking. Will the new credit facilities be enough?
Nike’s performance disaster. What it reveals about blind spots when dealing with data.
Let’s unpack!
OK Zimbabwe Restocking
OK Zimbabwe has been all over the news for the last week or so. The Herald reports:
“Bank guarantees, a combination of US$10 million from CBZ Bank and US$5 million from BancABC, have unlocked crucial credit facilities, enabling key domestic manufacturers to resume product deliveries, company sources familiar with the latest development have confirmed.”
If OKZ is genuinely turning around, that’s good news. Nobody wants to see one of Zimbabwe’s oldest retail chains disappear. However, one detail in the story is worth paying attention to.
The story states that OKZ is still running 44 stores. Is that too many even after dropping from about 70 stores?
Back in 2015, when OKZ was healthy, the company had 61 stores and carried $46.7 million in inventory. That works out to roughly $766,000 of stock per store.
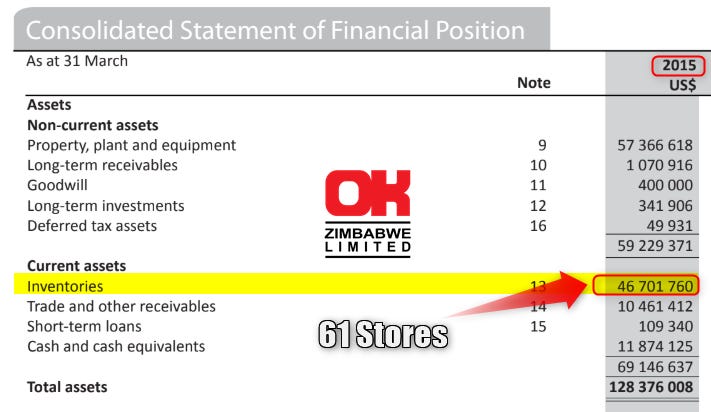
Apply that to 44 stores today, and you’d need about $34 million in inventory to be fully stocked. The facility is for $15 million.
But let’s assume OKZ already had about $6 million in inventory (based on the information here); then, with the $15 million facility, that brings you to potentially $21 million in stock if the facility is fully utilised.
That’s about 62% ($21m/$34m) of what a fully stocked network of 44 stores actually needs.
Would OKZ be better off with 20 fully stocked stores than 44 stores sitting at 62%?
Retail differs a bit from manufacturing in that utilisation does not scale linearly. If a factory moves from 30% utilisation to 60% utilisation, that is a big improvement.
However, in retail, moving from 30% stocked to 60% may not make much of a difference, as customers want availability close to 100% to encourage them to return.
To be fair, this step is still some progress. Getting any facility during the corporate rescue process is not easy. You have to start somewhere. OKZ stores will still need to move from “gaining momentum” to fixed very quickly.
Hopefully this will be the case, but it's definitely worth watching what happens. More likely than not, OKZ may need to cut even more stores.
But that is based on the data above, and as the next story shows, sometimes data can be tricky to handle.
Nike's Collapse: The Blind Spot in Data-Driven Strategy
Nike is being removed from the S&P 100, the index that tracks America’s 100 largest, most established companies. The stock closed at $38.40, its lowest level in 12 years, valuing the company at roughly $57 billion. That’s down from about $281 billion at its 2021 peak, a loss of over $220 billion in market value in five years.
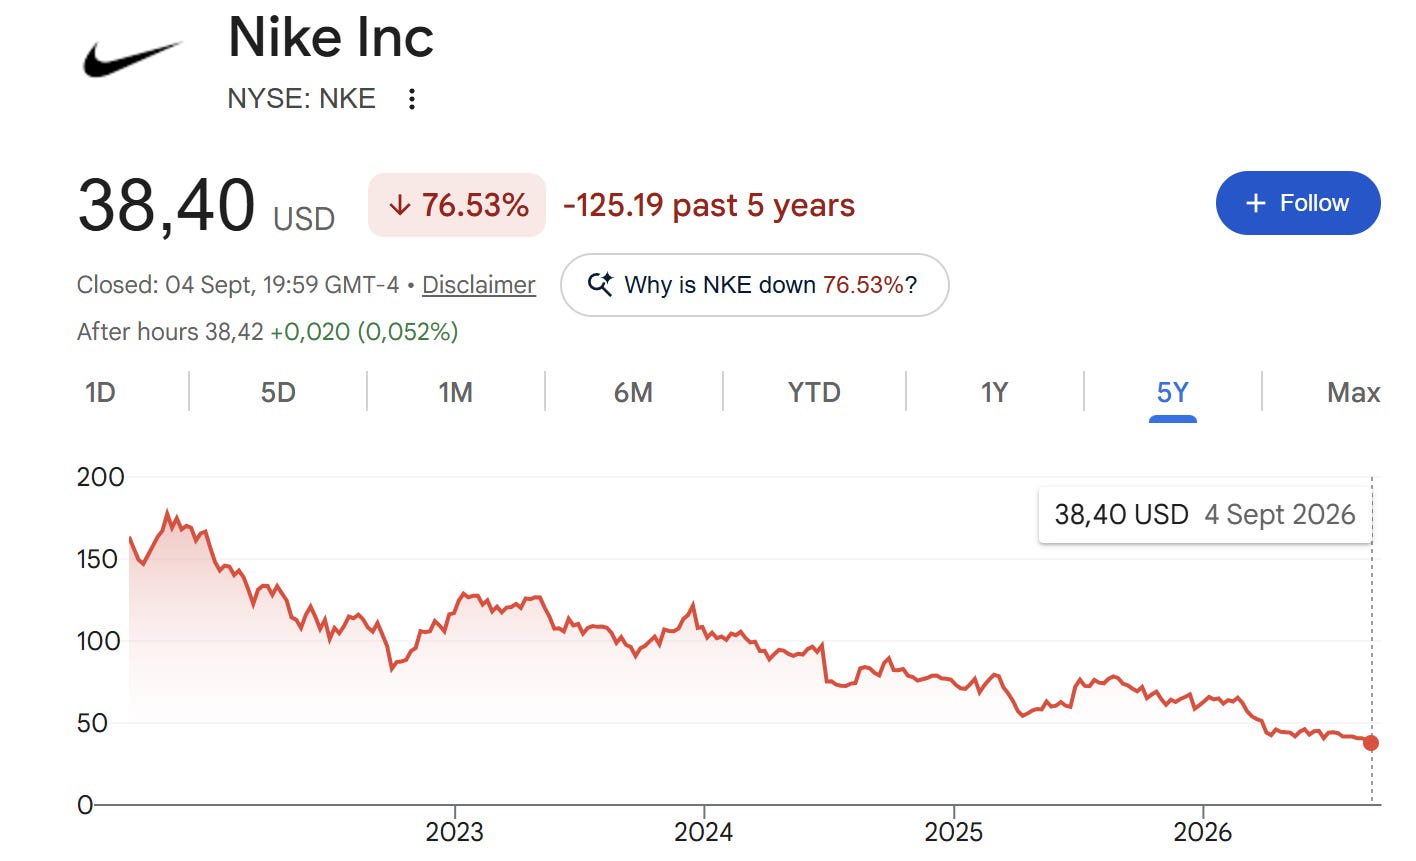
How does a brand as dominant as Nike end up here? The answer is that a data-driven strategy backfired spectacularly.
Before the crash, Nike’s go-to-market strategy was to partner with wholesalers like Foot Locker, which would sell its shoes to end consumers.
This meant Nike had to give up 40-50% of its margin and had limited data on who was actually buying its shoes, since the wholesaler owned that relationship.
The numbers seemed to paint a clear picture: for Nike to drive further growth and become more profitable, they needed to build their Direct-to-Consumer business. That is, selling their shoes directly to consumers on their online platform and in Nike-owned stores.
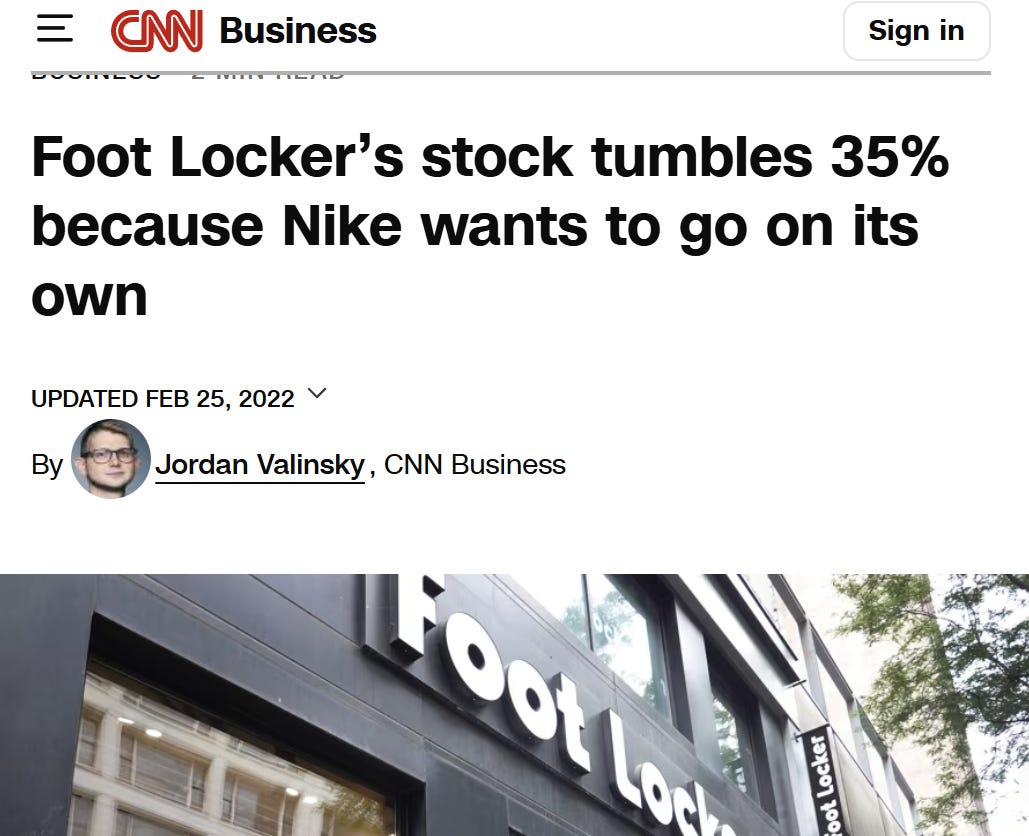
So Nike aggressively pulled back from supplying wholesalers. This shift was so drastic that it caused Foot Locker’s stock to fall 35% in a matter of days in 2022.
This pivot from Nike was bold but supported by data at the time. In 2021, the data suggested that the strategy was working. While sales to Wholesale Customers maintained good growth at 12%, sales through Nike Direct were up 32%.
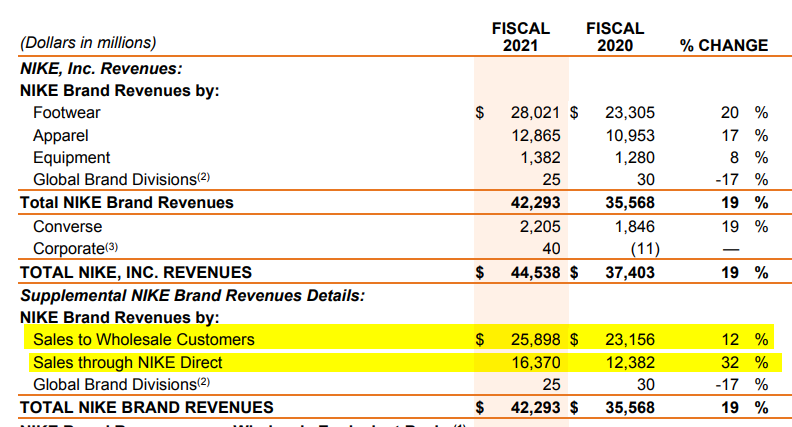
The impact of this was also very favourable from a profitability perspective, as more sales through Nike Direct meant not having to share margin with wholesalers.

With this “success”, it's easy to see why Nike could have been emboldened to be more aggressive in pushing its direct-to-consumer approach.
On 27 June 2022, in the release of their results, Nike CEO John Donahoe declared, “Our competitive advantages, including our pipeline of innovative products and expanding digital leadership, prove that our strategy is working”
However, in reality, Nike's strategy wasn’t working; what seemed like success was more so Nike benefiting from the online ecommerce boom that came with COVID.
While Nike vacated premium floor space at partners like Foot Locker, this opened the door for other smaller brands like Hoka, On Running, Brooks, and New Balance to quickly fill the gap and capture a large share of Nike’s core performance-running and lifestyle market.
Nike once had a 75% share among partners, such as Foot Locker; that share dropped to 60%. When the COVID online e-commerce boom ended, digital sales stalled, revenue growth softened, and the stock price crash accelerated.
By 2024, the CEO had been replaced by a Nike veteran, Elliott Hill, and over the next two years, Nike shifted back toward working with wholesale partners.
The lesson
Using data to make decisions is best practice in business and is valuable. But it’s also important to appreciate the value of understanding the business and the overall context, something that isn’t neatly captured in data.
The tailwind from COVID made the NIKE Direct business appear more successful than it actually was, and the risk of that tailwind reversing should have received more attention.
In 2021, e-commerce was booming for every retailer, not just Nike. So when NIKE Direct grew 32%, that wasn’t proof Nike had found the key growth level, but rather that Nike was riding a favourable wave.
The other key insight is thinking in terms of second-order effects.
First-order effects: The direct, immediate, and obvious result of a choice. They are easy to see and predict.
Second-order effects: The later ripple-effect consequences that emerge from those first-order results. They are often hidden, harder to predict, and can be positive or negative.
Often, we approach decisions in terms of the direct impact. For Nike, the idea was that if we cut out wholesalers and sold directly to consumers, we would get more data on our customers and higher margins.
But the second-order effect of that was leaving more shelf space for competitors to take and damaging relationships with retail partners who may never view Nike the same way again. Nike’s share with retail partners fell by 20% and has yet to recover as other brands took over.
So here are some big questions to ask next time you are considering a strategic pivot to ensure you have interpreted the data appropriately.
Does this data tell the full story, or just the part that’s easy to measure?
What are the possible unintended consequences of the decision we’re making, even if the data says we’re right?
Is there another explanation for what this data is showing us, one we haven’t considered?
Thanks for reading. What do you think?
P.S. I am working with publicly available information, so I could be wrong or missing something.
Good read this one. Well done Tinashe
Great insight Tinashe! Loved the Nike Story and the challenge of strategic blindspots.