

Did Delta Really Grow? The Week Ahead
Why comparing 21% revenue growth to 27% blended inflation is the wrong approach


Last week, the Big 3—Delta, Econet, and Innscor—all posted very strong results that showed big increases in revenue and volumes.
Delta, the beverage maker, started the run, and it led to quite a lot of discussion on what the revenue growth meant, especially as it relates to inflation.
This is what you need to understand as you digest the results in the week ahead.
Did Delta Really Grow? The Inflation Benchmark Debate
Delta grew revenue by 32%, or 21% when adjusted for the impact of the recent acquisition of Schweppes (which was previously an associate company).
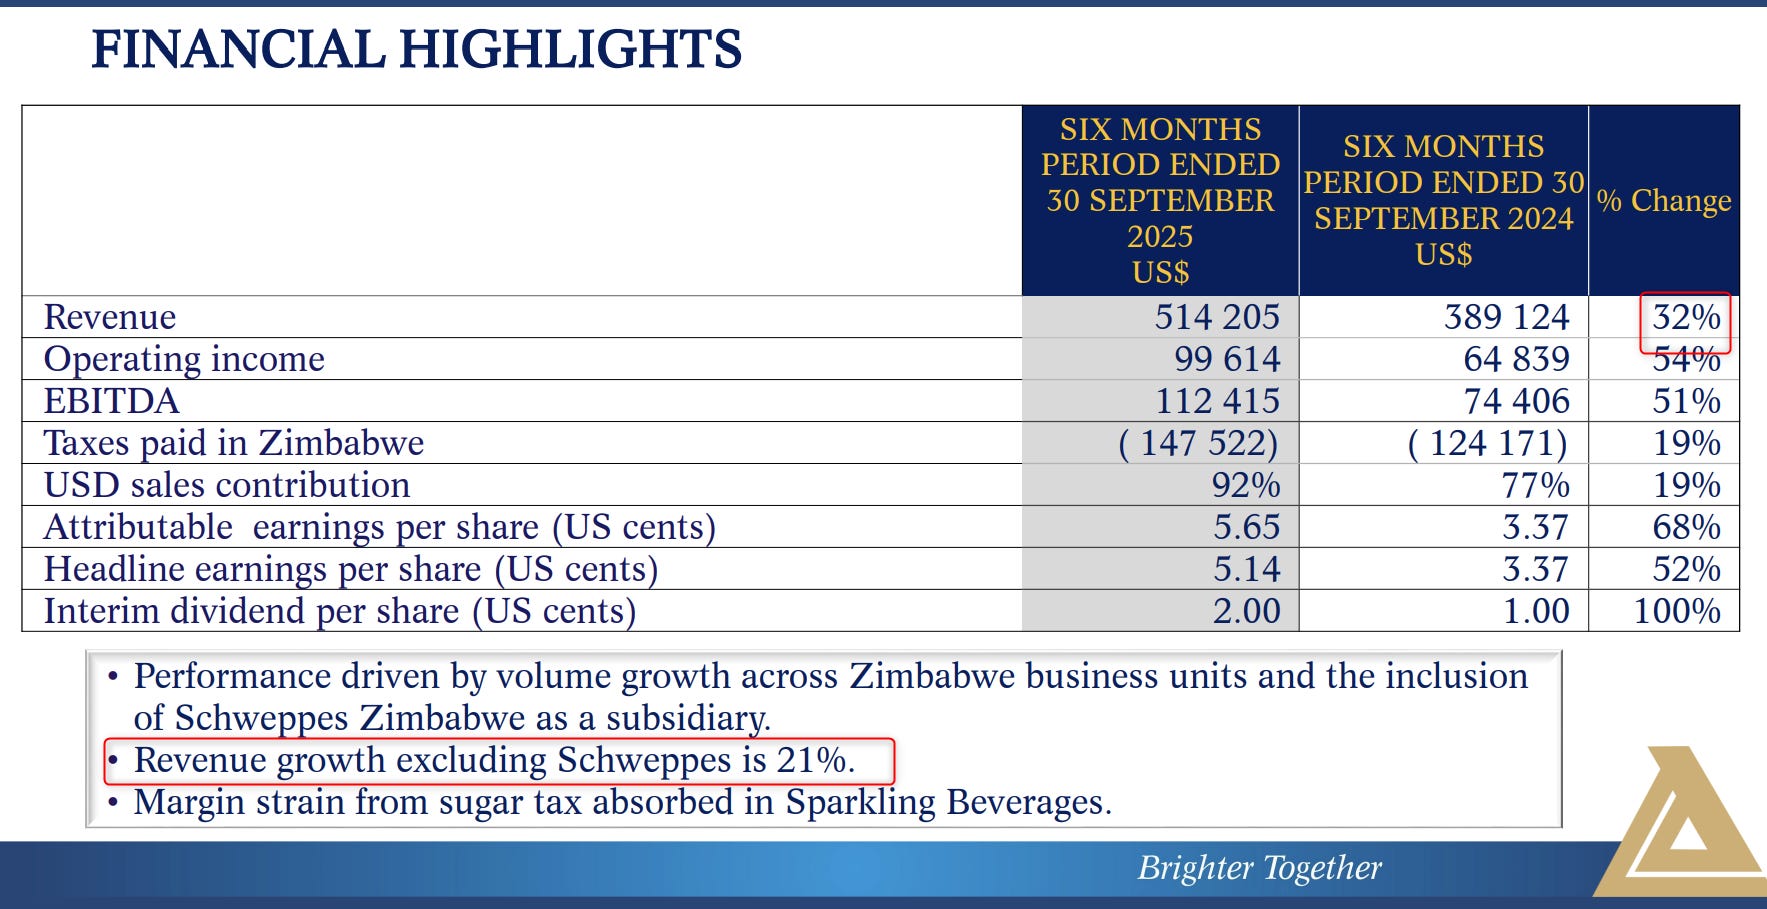
The core of the discussion centred around whether this 21% growth was meaningful or not, because it didn’t pass the blended inflation rate of 27%.
If the answer sounds obvious to you, then it’s even more important to read this, because the level of confusion around this topic is much more than you think.
The Basic Principle
The basic idea is that if a company’s revenue increases 5% but inflation is 10%, then in reality, the company didn’t really grow, because its revenue is now worth less than before due to inflation.
The above is generally accepted.
The issue, however, in Zimbabwe is how inflation is calculated and how it’s applied where blended inflation is made use of.
How Blended Inflation Works
Because of the multi-currency regime with ZiG and USD, Zimbabwe currently reports both USD inflation, which is 13%, and ZiG inflation, which is 83% as of September.
To get to one inflation number, blended inflation is then used.
The idea is that since about 80% of the economy is in USD and 20% is in ZiG, you can calculate a combined inflation rate:
(80% × 13% USD inflation) + (20% × 83% ZiG inflation) = 10.4% + 16.6% = 27%
This has been taken to be the benchmark rate of inflation and has also now been used to compare the growth rate of companies like Delta, which grew 21%, and conclude that the growth wasn’t real growth.
In other words, Delta’s growth was good on paper but not in reality.
The Problem with This Approach
One of the arguments for using the 27% is that this is the economy-wide purchasing power change you have lost over the last year (assuming the economy is 80% USD and 20% ZiG).
In other words, what you could buy for $100 last year, you would need to spend $127 for today.
However, this is not true.
Consider someone who made 100% of their income in USD and then had expenses that were 80:20 in USD and ZiG.
Let’s assume they had $100 of expenses.
Their $80 of USD expenses would now cost $90.40 (a 13% increase).
The ZiG expenses, which would have been ZiG 260 (that’s $20 at the old rate of 1:13), would have increased by 83% due to inflation to ZiG 475.80.
However, over the same period, the USD: ZiG rate moved to 1:26. This means that to settle ZiG 475.80 would now cost $18.30.
So in total, a year later, you would need $90.40 + $18.30 = $108.70 to settle those bills.
This means the purchasing power you have lost is around 8.7%, not 27%.
The example is not perfect, but it shows you can not use the 27% as the reference point.
The Other Approach Company-Specific Blended Inflation
The other approach that has been described is to use a company’s revenue mix to determine its own blended inflation and then compare that with the nominal growth.
In this case, Delta’s blended inflation would be calculated as follows:
Delta USD: ZiG revenue split is 92%:8%
(USD % of Revenue × USD Inflation) + (ZiG % of Revenue × ZiG Inflation)
(92% × 13%) + (8% × 83%) = 18.6% (approximately 19%)
This 19% would then be compared with the nominal revenue growth of 21%, implying a real revenue growth of around 2%.
This seems more reasonable, but makes the same mistake of not factoring in the exchange rate movements and so uses a lower growth rate for Delta.
Note: The textbook formula for calculating real growth is
[(1 + nominal growth) / (1 + inflation) - 1].
However, you can commonly use nominal growth minus the inflation rate to approximate the result. In the example above, the precise real growth is 1.7% compared with the 2% approximation. For simplicity, I will be using the approximation method unless specified.
If you wanted to compare Delta’s to the 19% blended inflation, you would need to calculate Delta’s “blended growth rate.”
This requires looking at the growth rate for the USD revenue and the ZiG revenue separately.
For example, assuming that prices stayed the same and the revenue split remained at 92:8, if you separated the USD revenue and the ZiG revenue, it would potentially look like this:
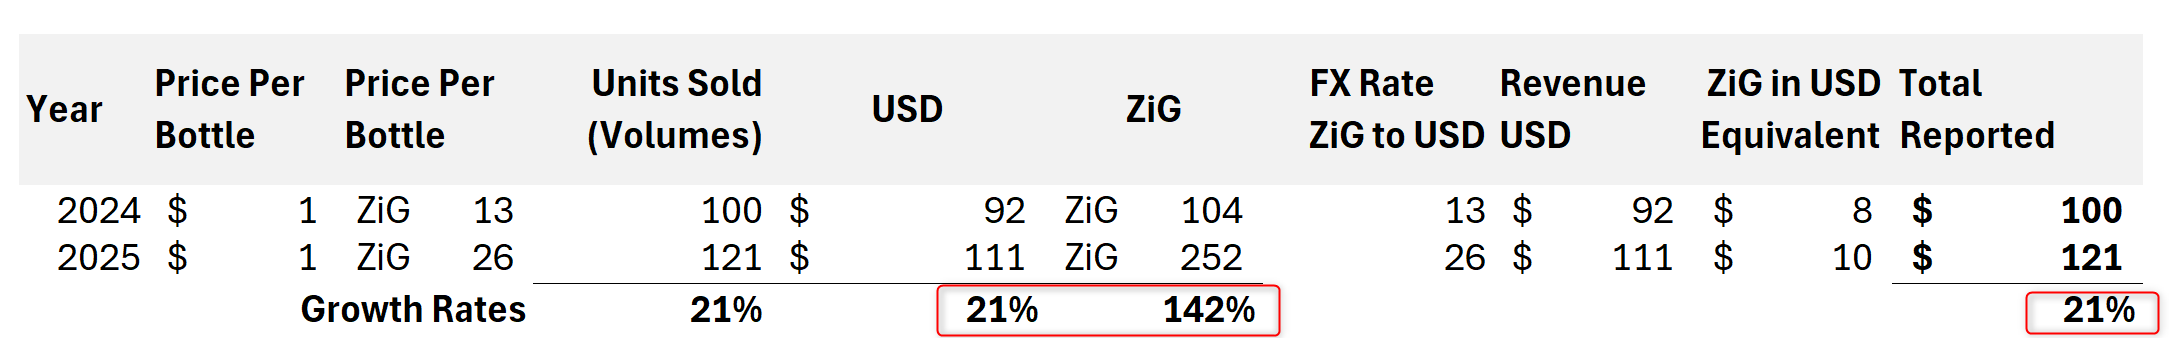
The USD revenue increased by 21%
The ZiG revenue increased by 142%, mainly due to the exchange rate change from 13 to 26, combined with the 21% volume growth.
In the accounts, this would show as a 21% growth in USD terms.
If you then calculated the blended growth rate:
(21% × 92%) + (142% × 8%) = 30.7%
This 31% is what you would then compare with the 19% blended inflation, and would give you about 10% real growth using the textbook calculation (or 12% using the approximation method).
As you can see, the differences can be quite significant, and if you had not made this calculation, you would have assumed real growth was only 2%.
The Simpler Approach
By far the simplest approach is to use the USD inflation and compare it with the USD growth.
For Delta, this would be the 21% compared with the 13%, giving you approximately 8% real growth.
This avoids all the unnecessary back and forth and calculations that are more likely to lead to confusion.
But is USD Inflation Really 13%?
One final note: USD inflation is currently 13%, which looks pretty high. Does this number make sense with what we are seeing in the financials of companies?
The biggest driver of the high USD inflation is the food and non-alcoholic drinks category, which has a 31% weighting. Inflation in this category, compared to last year, has reportedly increased 19%.
When you think of food and non-alcoholic drinks, you have to think of Innscor and Delta.
On Innscor, it doesn't look like they have been increasing prices of late; in fact, it seems the business is under pressure to maintain margins, judging by the drop in profitability.
For Delta, in the non-alcoholic segment excluding Schweppes, the average revenue per litre—which is a proxy for price, although not perfect—only increased by 3%.
So, where is the big increase in USD inflation coming from?
There are a few possible explanations:
Imported inflation from FX changes: Zimbabwe imports a lot of goods, and the USD has been depreciating against other currencies, which makes imports more expensive.
Tax changes: Should we call this Taxflation? The sugar tax and other changes in the VAT status of certain goods have likely increased prices.
Data collection sources: Prices in formal retail chains tend to be higher than in informal trade. Perhaps it could be a question of where the prices are being picked from?
Whatever the case may be, one thing I expect is that the USD inflation will come down significantly to under 10% by the first quarter of 2026.
Where’s the Money? What’s the Move?
The good thing about this confusion is that it seems many people still haven’t understood what these results mean. A lot of the companies that have shown impressive results are likely undervalued.
For the investor, if you believe this is the case, there’s still time to move in.
More generally, I mentioned a few weeks back that Delta is a good measure of the degree of economic activity, and the sharp increase in revenue seems to indicate that the economy is growing.
The strong results from Econet and Innscor seem to confirm this as well.
Thanks for reading! If you found this useful, please share it with your network. The more people who read, the more time I can spend unpacking companies you care about.
Did I miss talk of volumes?
This is what we call an illusion of growth